Data source: Febiac. Photo source: VW (T-Roc) & Alpine (A390).

Data source: Febiac. Photo source: VW (T-Roc) & Alpine (A390).

Mercedes-Benz moved up a place to third at the expense of Audi. The latter recently ended car manufacturing in the country which may have had a slight bearing on that. Tesla looks not too bad at 15th...until it's compared to last year's 10th ranking. With market share down 49% YTD, it's not going well.
Volvo was down 27% and Mazda dropped 38%. MINI was up 40%, Polestar improved its numbers by 31% and BYD gained 89% volume and Xpeng was up 454%. Chinese brands haven't been that successful here so far and while some of their increases are impressive, they are from a low level of sales in 2024.
The leading four brands aren't moving around to any degree but below that, some volatility can be observed. Fifth to eighth all had gains in market share with Dacia and Volvo in particular doing well. Peugeot has not had a good year as is true of sibling brand Citroën. Ford and Opel are not doing well in Europe generally.
Data source: FEBIAC.
Two of the lowest lying car markets in Europe are compared in a brand head to head. Market share is compared and a percentage figure favouring one country appears in that country's side of the charts. Some predictable outcomes and the odd surprise.
Overview: Belgian registrations in 2023 were 475,000 and the Netherlands 370,000 Belgium has more brands on its side because it excels in winning with many smaller brands.
German brands: VW is big in both markets and has about the same penetration in both, with Belgium winning by fractions, literally.
UK Brands: They are much better supported in Belgium. Bentley and Rolls Royce are on the other side though.
French Brands: Renault is just in the Netherlands but its budget brand with Peugeot and Citroën in Belgium.
Japanese brands: Definitely more popular in the Netherlands, especially Mitsubishi. Subaru, Lexus and Honda are on the other side but they are not big volume brands.
Summary: Many brands are similar but with some extreme variances too. British brands are very much on the Belgian side while the Chinese are much more established in the Netherlands.

Belgians love their cars so the last few years must have frustrated many with limited supplies. The restraints are now off and sales have taken off. December was up 5% and for the full year the figure is +30%. The 'Diff' column shows market share change. Nearly all brands actually increased sales.
BMW achieved its third year at the top of Belgian registrations. VW will have a challenge to change the situation. Audi came up to third, passing Mercedes-Benz and Peugeot in doing so. Volvo has done well so far and now entered the top ten list.
Tesla isn't as successful here as many other comparable countries in Europe but is getting there. Land Rover is cracking on nicely as is Cupra. Chinese brands are slowly making their way up the chart but for now, are not having that much impact although MG has had a good year.
Data source: Febiac.
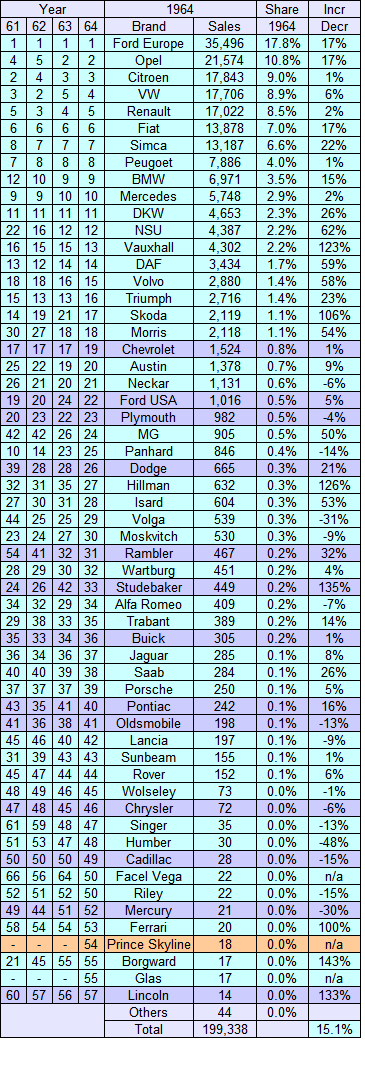
Most of the brands were European if one counts Ford's and GM's subsidiary brands from that region. One Asian brand squeaked in but it would be a lone effort until others started to arrive two to three years later.
Data source: Statbel.

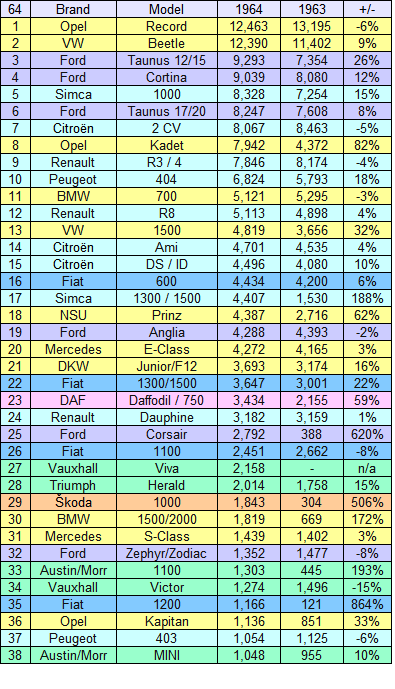
There were at least 37 models that exceeded 1,000 sales in 1964. I say "at least" because I couldn't get a model breakdown for Volvo which would have had representation here otherwise. Chevrolet may have too.
The chart is rather colourful but they are broken down by where the brand originated. It's handy if you want to focus on a country of origin in particular. All the cars listed would have been made in Europe and there were no sales of Asian brands at all, a contrast with today. The data wasn't presented on a platter so some work was required in some cases to sort it out. That's not a criticism by any means, it's nice to have access to it at all. It's just occasionally a bit of estimating was used.The pictures are at top the Renault 4, then the BMW 1500 and finally the Škoda 1000. In the last pic, an interesting way to flag down a passing motorist.
Data source: Statbel. Pictures: Netcarshow.
Refining this information has had its challenges but overall an accurate portrayal of the situation back then in Belgium. For brands was surprisingly stable considering things were still settling down after an horrific conflict was still having an impact, albeit less so as each year passed.
Trends were evident though. Passenger cars imported from the US dropped from 12,000 in 1955 to 5,375 in 1959 despite overall sales increasing. That was a drop from 15.4% to 5.3%. I assume that was due to European supply improving and since US manufacturing was not as disrupted, it inflated US penetration after WWII for a period of time.
Over the same period, Geman brands increased from 33,600 to 45,275 (43% to 45% of the total). England went from 11,200 to 9,100 (14.4% to 9%). With a commonwealth of nations eager for cars, England had to balance the two with the ability to supply a challenge.
France increased strongly over this period, up from 16,800 to 32,300 units (21.7% to 32%). Peugeot and Simca increased the most of the leading French brands. Even so, Citroen was much stronger in Belgium than Peugeot was back then.Of the other countries (mainly Sweden), sales went up over the five years being considered here from 1.8% to 3.9% and reached 3,900 units by 1959. In total sales went up from 77,800 in 1955 to 100,800 in 1959. That wasn't outstanding but solid nonetheless and the next five years would see registrations double.
Data source: Statbel. Pics: netcarshow.com

I've been scratching around Statbel and found some interesting historical data. So a big call out to them for making this available. It's not often older data is accessible. I have a lot more but I don't know how much statistical information on Belgium is of interest.
As for the chart to the right, some obvious and predictable things are there but also things to surprise. I've shaded the USA in a different colour and they were more popular than I expected. Belgium wasn't protected like the larger European markets were at the time so that would have helped.
I'm not sure if supply was an issue for some brands as they rebuilt after the war and sourcing materials may have still been problematic even ten years after hostilities ceased.
I did think of combining brands belonging to the same company but then thought seeing the brands separate would be more enlightening anyway.
Ford Europe was one brand, sourcing cars from England, France and Germany. Opel and Vauxhall were both owned by GM but both brands were sold their products which were quite different.
Some brands are now only found in history books (and blogs like this). DKW became Audi. Austin, Morris and several other English brands were merged and became MG Rover which was eventually killed off altogether. Shameful.
Enjoy the data. It took a while to assemble. The source seems to have total sales slightly higher than is generally found elsewhere. It could be down to what constitutes a passenger car or even if new cars imported privately are counted or not.
The car above is the Ford Taunus, sourced from Germany. The name used from 1939 to 1994 and unusually covered two different sized models. The above is the smaller car which went from 1952-59.
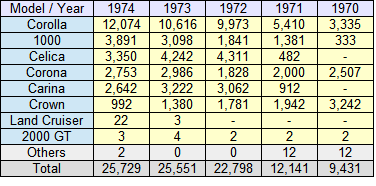
I always thought that Toyota came of age at the beginning of the 1970s. They may have already achieved that earlier but I think the series two 1970 Corolla (pictured right) was a huge step up on the first one in terms of styling at least. The fourth generation Corona of the same era was likewise a much better looking car in my eyes at least. Sales reflected greater acceptance around this time in Belgium. The 1000 (picture to the left) was a solid if not a spectacular performer.Numbers gathered pace quickly from the brand's introduction in 1966. Most sales were for the Corolla several other models did reasonably well too. The Crown was very popular in 1970 but fell away sharply but other models more than made up for that. This was a successful five years for Toyota Belgium.
Data source: Statbel.

The Triumph brand was one I always liked. One model I really took a fancy to was the Dolomite Sprint, sporty yet not flashy. The 2500 was a class act and of premium quality. The range was eclectic with basic, premium and sports cars. Yet they all came together nicely.
In 1970, they were still selling quite well in Belgium but with the mainstream Herald range (above) and 1300 models coming to an end without replacement, the numbers fell dramatically. The 2000/2500 (above) was aging too and it likewise was without a replacement. The only bright spot, for now at least, was the Spitfire sports car (right). The GT6 was retired while the TR6 and Stag were selling in numbers one would expect.Chrysler Europe wasn't successful but Simca was selling well in Belgium. The small hatchback 1100 was the most popular model by 1974, with the 1300/1500 medium/large sedan was consistent in volume. The small 1000 (picture above) was coming toward the end of its life and I presume the 1200 was a sports coupe which was in runout mode at this time.
The Chrysler-Simca 160/180/2L is listed here, although not a Simca product. It was mainly designed in the UK and built in France and then later in Spain. It was also the basis for the Centura model in Australia. European sales were affected by strong competition from more established manufacturers such as Ford and GM.
Data source: Statbel.
Thanks to Statbel, I was able to piece together some data from years gone by. It's basically accurate although some of the entries needed deciphering so I believe I got it right. It doesn't quite line up with total figures I've seen elsewhere so that will come down to how they are counted.
The Mini was the main selling model which isn't surprising as it was assembled here. It exceeded 50% of the total each of the years below and sometimes well over that.
The Allegro model arrived in 1974 so its sales impact in the country was still undetermined. It was assembled in Belgium (150,00 in total) and exported so high hopes were held for its success. It replaced the 1100/1300.
Although the title says Austin and Morris, in 1973 the name Leyland was mostly - but not entirely - replacing them both in the data source. I don't know if that was simply how they were recording it or if it was reflected on logos on cars. Austin and Morris did duplicate models. Either way, sales were quite strong in Belgium.
Picture source and for all things BL (but too many ads) : AROnline.

Registrations for December were +21% but that wasn't enough to stop 2022 ending on -4%. The '+/- diff' column below is for market share change.
BMW showed that 2021 was no fluke by continuing at number one for the 2022. After that, it's fairly tight with VW, Peugeot, Mercedes and Audi in reasonably close proximity. Toyota is looking as a potential disrupter as it presses toward the top placings. Mitsubishi sales have ceased during the year.
For the month, BMW was the best selling brand with an increase of 86% on the corresponding month in 2021. The last time 10.4% share was bettered was a decade ago in 2012 when VW took 10.7%.
Data source: FEBIAC.

Registrations for December were -32% and -11% YTD. The '+/-' column below is comparing market share variance for 2021 with 2020. That's a poorer result than others we have had up until now. The 383,000 sales are well shoer of the 550,000 of 2019. Still, Belgians can think of all the money they are saving.
BMW has bumped VW aside as it took a strong lead at the top. In an even market that doesn't usually have any one brand exceed 10% of the total, BMW has just broken that barrier. Renault continues its policy on pulling back on volume while down the bottom of the list some new entrants are starting to make their mark.
Point of interest: Traditionally, VW has been the top brand, but over the decades, Opel, Renault and Peugeot have had turns leading the way. Never has a premium done so before so this is new.
BMW did recently state it was going to focus less on volume in the future. It will be interesting to see if that is carried out. For now, I have to say their chip supply seems pretty good.
Data source: FEBIAC.
BMW took back lost ground from the previous year, now well ahead combined with MINI. Volvo didn't have a good year, Tesla and Lexus likewise. Land Rover clawed back some of the share it conceded in 2019. Polestar arrived but too early to see what impact that new brand will have.
Data source: FEBIAC.
| Belgium Pick-Up Sales | |||||||
| Make | Model | 2019 | 2018 | 2017 | 2016 | 2015 | |
| Ford | Ranger | 2,154 | 2,124 | 2,010 | 1,782 | 1,186 | |
| VW | Amarok | 790 | 858 | 897 | 589 | 547 | |
| Toyota | Hilux | 773 | 789 | 841 | 844 | 885 | |
| Nissan | Navara | 770 | 870 | 1,033 | 914 | 409 | |
| Mitsubishi | Triton | 748 | 971 | 981 | 706 | 614 | |
| Mercedes | X-Class | 487 | 375 | 46 | - | - | |
| Isuzu | D-Max | 406 | 369 | 380 | 595 | 577 | |
| Fiat | Fullback | 86 | 161 | 253 | 106 | - | |
For more on pick-ups, try these if you wish.
2019: Australia/New Zealand/South Africa
2015-19: Belgium Denmark France Iceland Italy Sweden United Kingdom
Argentina Brazil Indonesia Thailand
2015: World Top 50
| Years | Brands/Year | 2019 | % | 2018 | % | 2017 | % | ||
| 17 | 18 | 19 | Total | 165,528 | 0.1 | 165,427 | -2.1 | 168,953 | 4.1 |
| 1 | 1 | 1 | BMW Group | 44,718 | 27.0 | 48,273 | 29.2 | 49,718 | 29.4 |
| BMW | 36,643 | 22.1 | 40,072 | 24.2 | 42,188 | 25.0 | |||
| Mini | 8,075 | 4.9 | 8,201 | 5.0 | 7,530 | 4.5 | |||
| 2 | 2 | 2 | Mercedes | 37,938 | 22.9 | 35,526 | 21.5 | 37,419 | 22.1 |
| 3 | 3 | 3 | Audi | 31,183 | 18.8 | 28,710 | 17.4 | 33,323 | 19.7 |
| 4 | 4 | 4 | Volvo | 21,302 | 12.9 | 20,155 | 12.2 | 18,024 | 10.7 |
| 5 | 5 | 5 | JLR | 7,934 | 4.8 | 10,231 | 6.2 | 9,169 | 5.4 |
| Land Rover | 4,760 | 2.9 | 6,274 | 3.8 | 5,944 | 3.5 | |||
| Jaguar | 3,174 | 1.9 | 3,957 | 2.4 | 3,225 | 1.9 | |||
| 9 | 9 | 6 | Tesla | 3,690 | 2.2 | 878 | 0.5 | 1,151 | 0.7 |
| 6 | 6 | 7 | Porsche | 2,754 | 1.7 | 3,222 | 1.9 | 3,450 | 2.0 |
| 7 | 7 | 8 | Alfa Romeo | 1,935 | 1.2 | 3,011 | 1.8 | 2,610 | 1.5 |
| 8 | 8 | 9 | Lexus | 1,479 | 0.9 | 1,468 | 0.9 | 1,656 | 1.0 |
| 11 | 10 | 10 | Maserati | 174 | 0.1 | 222 | 0.1 | 317 | 0.2 |
| 10 | 11 | 11 | Infiniti | 21 | 0.0 | 166 | 0.1 | 382 | 0.2 |
| - | 12 | 12 | Cadillac | 1 | 0.0 | 11 | 0.0 | ||